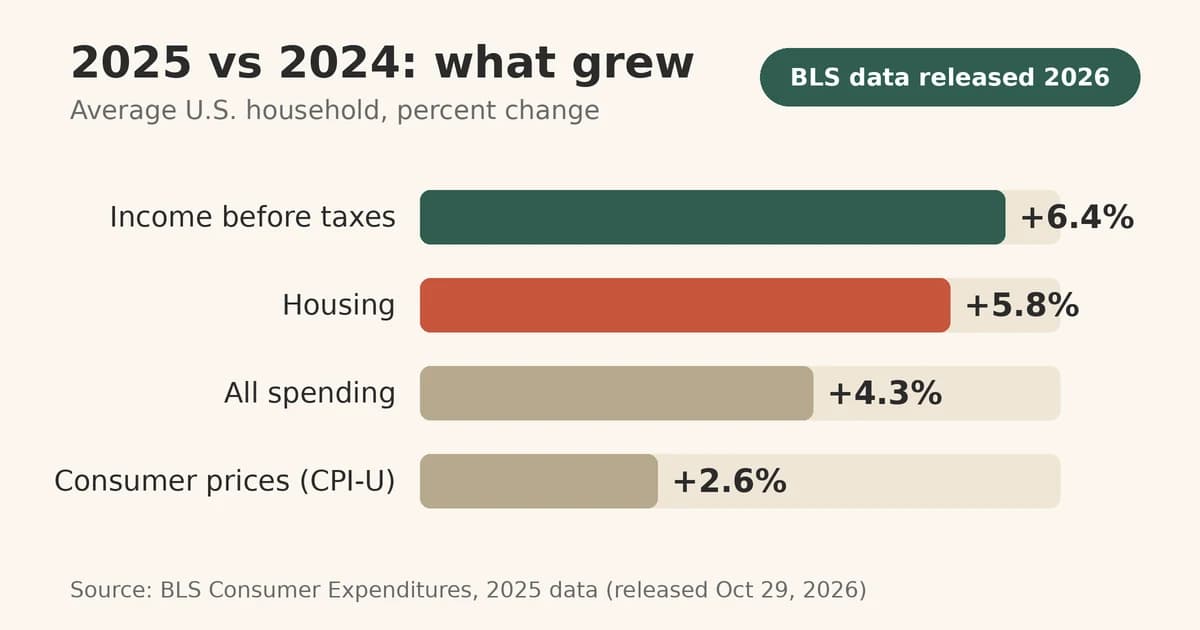
On October 29, 2026, the Bureau of Labor Statistics reported that average housing costs for a U.S. household rose 5.8 percent in 2025, more than double the 2.6 percent increase in consumer prices. The same release makes it possible to grade each fixed bill against two yardsticks, inflation and average income, and the scorecard below does that item by item.
Table of Contents
Housing Costs and Other Fixed Bills: The Scorecard
The BLS Consumer Expenditures release reports average annual spending per consumer unit, the unit the agency uses to represent a household. Average income before taxes rose 6.4 percent in 2025, and consumer prices rose 2.6 percent. The table compares each fixed item with both.
| Item | 2025 spending | Change | Against prices (2.6%) | Against income (6.4%) |
|---|---|---|---|---|
| Housing | $27,790 | 5.8% | Faster | Slower |
| Shelter | $17,626 | 8.0% | Faster | Faster |
| Rented dwellings | $6,272 | 10.8% | Faster | Faster |
| Owned dwellings | $9,988 | 7.3% | Faster | Faster |
| Utilities, fuels and public services | $4,931 | 4.1% | Faster | Slower |
| Health insurance | $4,310 | 6.3% | Faster | Slower |
| All spending | $81,905 | 4.3% | Faster | Slower |
Every item in the table outran prices. Only shelter, rented dwellings and owned dwellings also outran income, and housing as a whole came close. It is the largest category, at 33.9 percent of all spending. Utilities moved 4.1 percent in the same year, and the mechanics behind one utility bill are unpacked in Why Your Electric Bill Went Up: 4 Checks in the Right Order.
Where Averages Mislead
Three details limit how far the scorecard travels. The first is significance. The BLS release marks the housing, shelter, rented dwellings, utilities and health insurance changes as statistically significant and the owned dwellings change as not.
The second is a gap in collection. Federal data collection stopped in October and November 2025 during a lapse in appropriations, and BLS adjusted its weights for the missing months.
The third is the average itself. An income gain of 6.4 percent says nothing about one household’s raise. Take a hypothetical $5,200 monthly paycheck with $2,340 of fixed bills, a fixed-to-income ratio of 45 percent. If those bills rise at the 5.8 percent housing rate, they add $135.72 a month. A 3 percent raise adds $156, which nets out to $20.28 and still lifts the ratio to 46.2 percent. Only a raise above the housing rate lowers it.
For the wider question of pay against prices, see Do Raises Beat Inflation in 2026? What BLS Data Shows, which draws on BLS earnings series.
Property Taxes Run on Their Own Calendar
Property taxes sit outside the BLS items above and follow a separate schedule. ATTOM’s 2025 property tax analysis found that the average single-family home generated $4,427 in property taxes, a 3 percent increase over the previous year. The average estimated home value fell 1.7 percent to $494,231, and the national effective tax rate rose to 0.9 percent, the highest since 2020.
ATTOM links the rise to local fiscal pressures and policy decisions as well as market conditions, which is why bills can climb while average home values slip.
By state the range is wide. ATTOM reports that New Jersey topped the list with an average bill of $10,499, nearly ten times the bill in the lowest-tax markets. The highest effective rates were in Illinois at 1.84 percent, New Jersey at 1.58 percent and Vermont at 1.4 percent.
For homeowners who pay through escrow, the increase arrives inside the monthly mortgage payment. The mortgage view of these increases appears in Property Tax Increases Are Raising Fixed-Rate Mortgage Payments.
Frequently Asked Questions
Do these averages apply to renters?
Partly. Spending on rented dwellings rose 10.8 percent in 2025, a significant change according to BLS, while the 7.3 percent rise for owned dwellings was not statistically significant. Renters and owners face different bills.
Is there a safe fixed-to-income ratio?
This article does not set one. The government figures describe average spending and give no recommended limit. The useful comparison is your own ratio from one year to the next.
Why did the 2025 BLS data have a gap?
The Census Bureau could not collect the survey in October and November 2025 because of the lapse in federal appropriations. BLS says it used a weight adjustment to account for the missing data and that collection resumed on December 5, 2025.
About the Author
Wealth Power is edited by Dilip Kumar Bharati. Articles on U.S. personal finance are researched and drafted with AI assistance using public sources such as IRS data, Bureau of Labor Statistics reports and Federal Reserve publications, and are reviewed and edited by him before publication.
Disclaimer
Disclaimer: This article is for informational and educational purposes only and does not constitute financial, tax, or legal advice. Individual financial situations vary. Readers should consult a qualified financial, tax, or legal professional before making any financial decisions.